The operator Plot draws the graph of a function of a real variable in the plane Oxy.
In the simplest syntax, the argument is made up of a function and a list (braces) with three elements: the variable of the function and the extremes of its range.
| Mathematica | result | example |
|---|---|---|
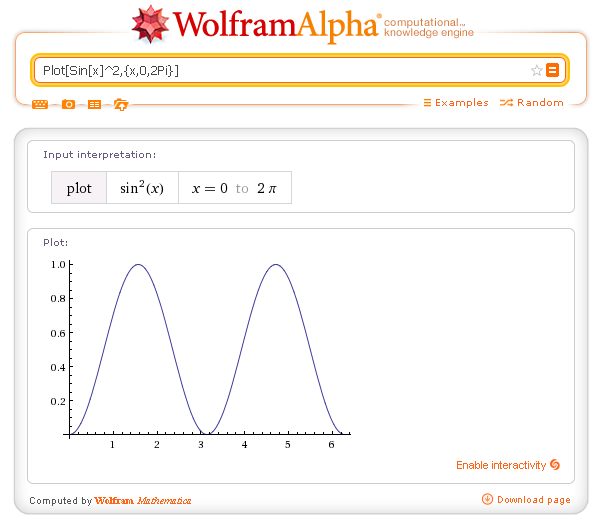
| Plot[f[x],{x,xmin,xmax}] | draws the graph of the function f(x) in the interval [xmin,xmax] | Plot[Sin[x]^2,{x,0,2Pi}] |
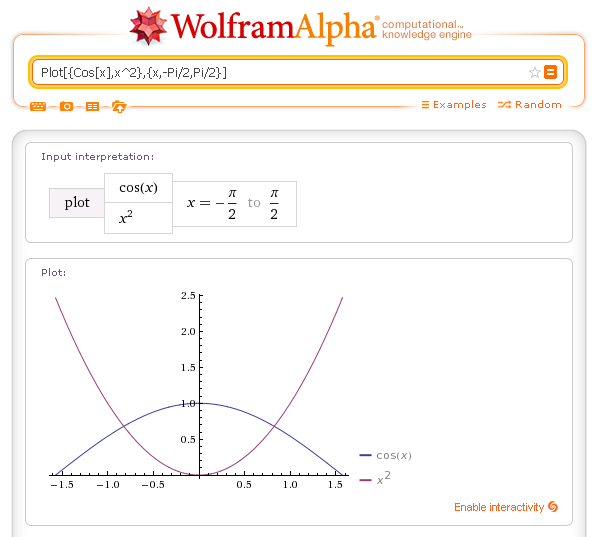
| Plot[{f[x],g[x]},{x,xmin,xmax}] | draws the graph of the functions f(x) and g(x) in the interval [xmin,xmax] | Plot[{Cos[x],x^2},{x,-Pi/2,Pi/2}] |
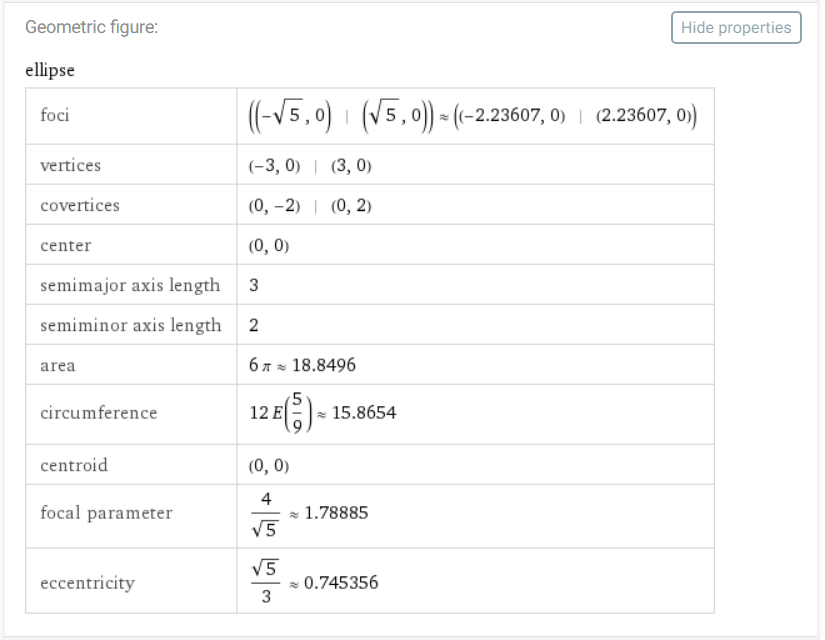
| ImplicitPlot[f[x,y]==g[x,y],{x,xmin,xmax},{y,ymin,ymax}] | draws thi curve given by the points whose coordinates satisfy the equation in two variables f[x,y]==g[x,y] whitin the rectangle {x,xmin,xmax},{y,ymin,ymax} | ImplicitPlot[1/9x^2+1/4y^2==1,{x,-3,3},{y,-2,2}] |
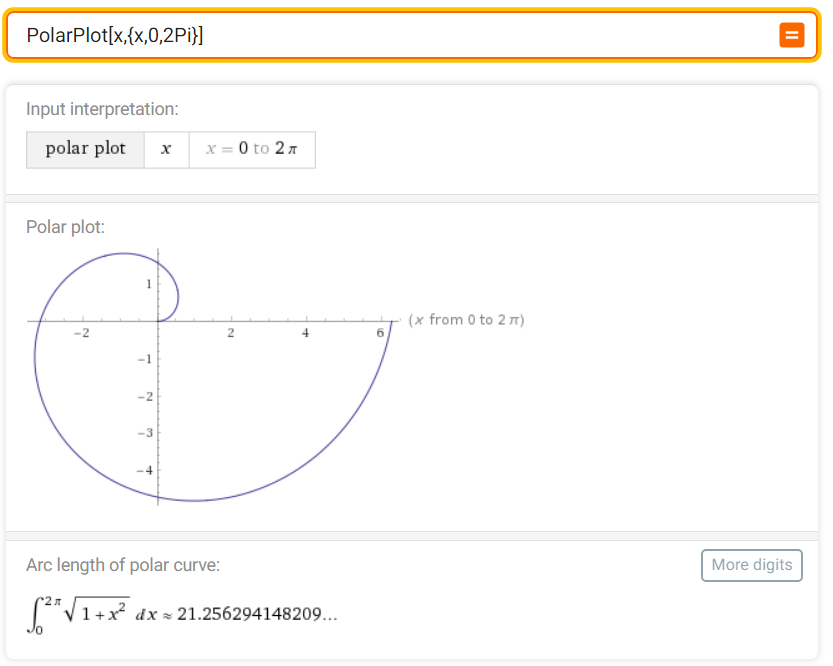
| PolarPlot[r[x],{x,xmin,xmax}] | draws the graph of the curve formed by the points with distance r(x) from the origin, where x is the polar angle, variable in the interval [xmin,xmax] | PolarPlot[x,{x,0,2Pi}] |
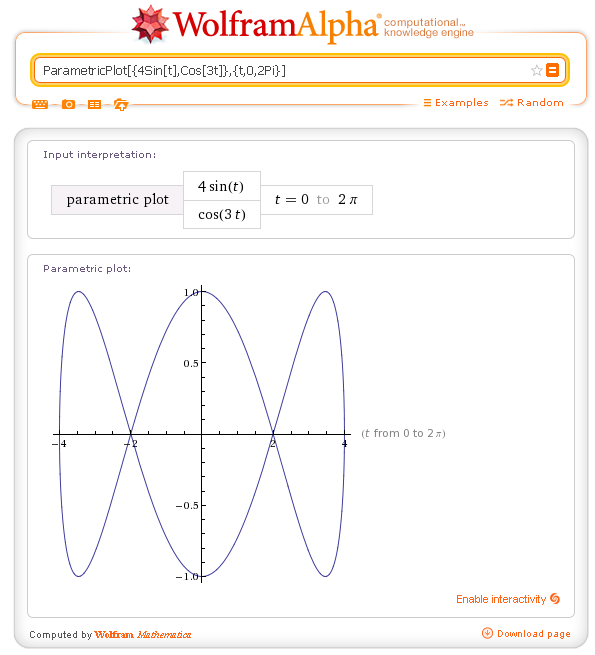
| ParametricPlot[{x[t],y[t]},{t,tmin,tmax}] | draws the graph of the curve formed by points with coordinates (x(t),y(t)), with t variable in the interval [tmin,tmax] | Plot[{Cos[x],x^2},{x,-Pi/2,Pi/2}] |
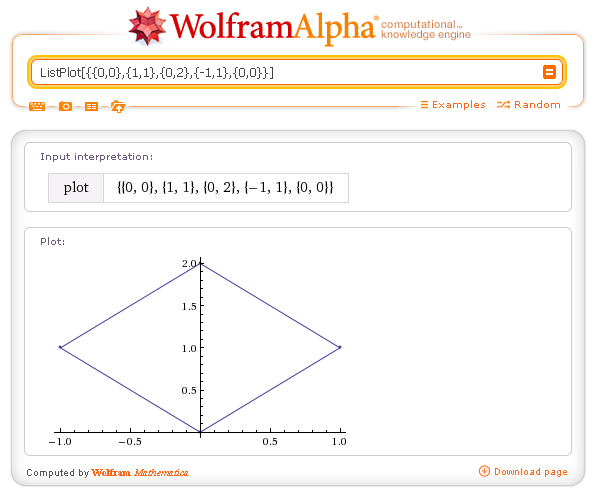
| ListPlot[{{x0,y0},{x1,y1},{x2,y2},...{xn,yn}}] | draws the polygonal line with vertices {xi,yi} | ListPlot[{{0,0},{1,1},{0,2},{-1,1},{0,0}}] |
Examples.
Graph of a function: Plot[Sin[x]^2,{x,0,2Pi}]
Graph of two functions: Plot[{Cos[x],x^2},{x,-Pi/2,Pi/2}]
Graph of a curve defined by an equation in two variables: ImplicitPlot[f[x,y]==g[x,y],{x,xmin,xmax},{y,ymin,ymax}]
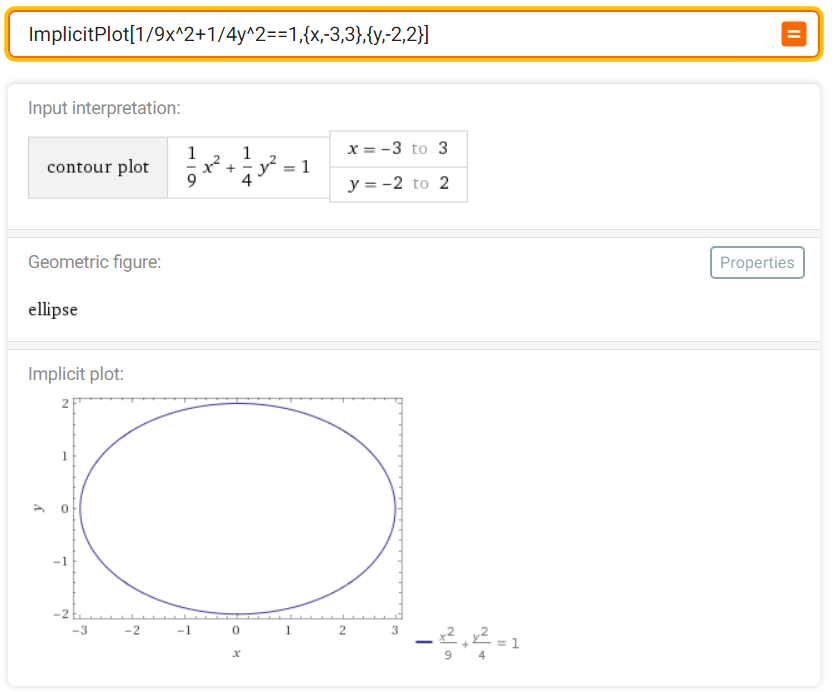
In this example, by clicking on the Properties button, you get some properties of the curve.
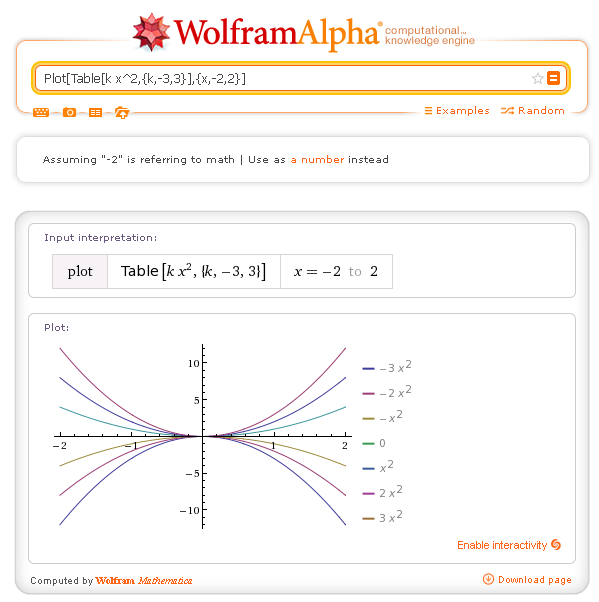
A set of parabolas: Plot[Table[k x^2+k,{k,-3,3}],{x,-2,2}]
A spiral: PolarPlot[x,{x,0,2Pi}]
A Lissajous curve: ParametricPlot[{4Sin[t],Cos[3t]},{t,0,2Pi}]
A square: ListPlot[{{0,0},{1,1},{0,2},{-1,1},{0,0}}]
| Mathematica | result | example |
|---|---|---|
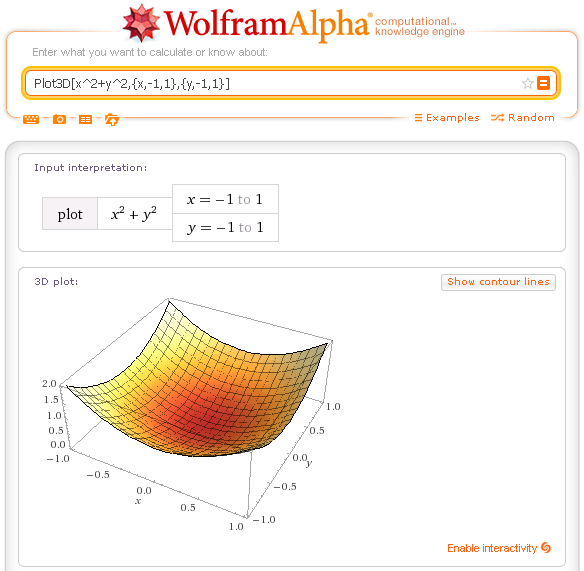
| Plot3D[f[x,y],{x,xmin,xmax},{y,ymin,ymax}] | gives the graph of the function f(x,y) in the domain [xmin,xmax][ymin,ymax] | Plot3D[x^2+y^2,{x,-1,1},{y,-1,1}] |
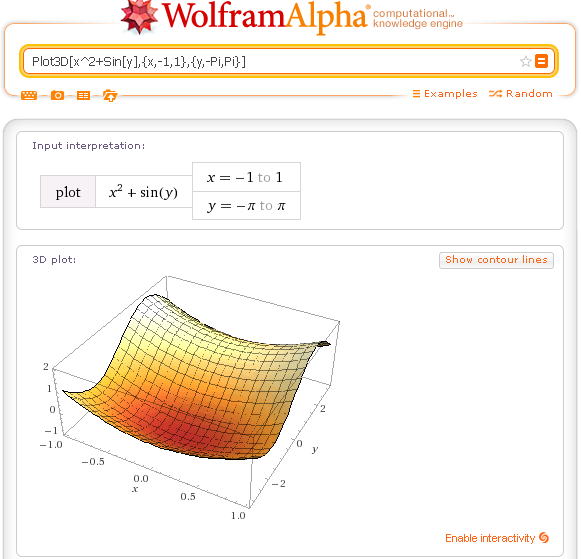
To view the graph of a real function of two real variables in the space Oxyz, you have to use the operator Plot3D.
In simpler syntax of Plot3D, the argument is made up of a function of two variables and two lists (braces), each consisting of three elements: the variable of the function and the extremes of the variability interval.
Examples.
Graph of a paraboloid: Plot3D[x^2+y^2,{x,-1,1},{y,-1,1}]
A more varied surface: Plot3D[x^2+Sin[y],{x,-1,1},{y,-Pi,Pi}]