If the sample space of a random variable x coincides with the set of the real numbers, a real continuous function p(x) such that

is said a probability density function.
The probability of an event [a,b] is given by
![]()
Generalizing the definitions given in the previous section for discrete distributions
the mean value of x is given by
![]()
the mean value of the squares is
![]()
the variance is

Example.
If p(x) is defined as

it is a probability density. In fact, in the range in which it is greater than zero, it is graphically represented by a
semicircle of radius
![]() . The area of this semicircle, and
then the integral from -∞ to +∞, is 1.
. The area of this semicircle, and
then the integral from -∞ to +∞, is 1.
A function p(x) such that

is said a uniform continuous distribution
The mean value is
![]()
The mean of the squares is
![]()
The variance is
![]()
and the standard deviation
![]()
Given a real positive value λ(lambda), the function p(x) such that

is said a exponential continuous distribution.
This function is always > 0 and

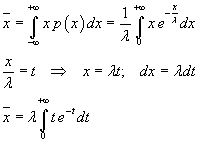
The mean value is

Integrating by parts

![]()
The mean value of the squares is

Integrating by parts

The variance is
![]()
and the standard deviation
![]()
The following JavaScript application allows you to calculate and to graph an exponential distribution. To view the tables, your browser must allow popups.
The following JS application allows to calculate the probability that in an exponential distribution with prefixed λ an event takes values between x1 and x2
Given two real positive values A and a, a function p(x) such that
![]()
is a probability density function if

Since p(x) is an even function, this equality is equivalent to the following

We can demonstrate that

so
![]()
Then p(x) depends only on the parameter a
![]()
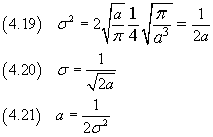
Since p(x) is an even function, its mean value is 0 and its variance is

We can demonstrate that

then

Now we can write p(x) directly in terms of its variance

The equality (4.22) is said a gaussian distribution. The graph of this curve is the well known bell curve, symmetrical about the y-axis, with a maximum at x=0 and inflexion points at ±σ.
If we translate the curve of a quantity μ, its equation is expressed by

The following JavaScript application allows you to calculate and to graph a gaussian distribution. To view the tables, your browser must allow popups.
The following JS application allows you to calculate the probability that in an exponential distribution, with mean 0 and prefixed σ, an event takes values between x1 and x2